


XRP price has remained below $1.10 as renewed U.S.-Iran hostilities, surging oil prices, and weakness across technology stocks have kept crypto traders cautious.
Summary
- XRP price trades near $1.09 as rising oil prices and geopolitical tensions weigh on crypto sentiment.
- A confirmed breakout above $1.12 could trigger short liquidations and open a move toward $1.17.
- Losing the $1.07 support level would weaken the recovery setup and expose XRP to a deeper decline.
XRP (XRP) price traded near $1.09 at the time of writing, down about 0.2% over the past 24 hours but up 1.3% on the week. Trading volume rose 22.5% to roughly $828 million, while its market capitalization stood at $68.3 billion, according to CoinGecko.
Risk appetite deteriorated after Brent crude briefly reached $91.42, its highest price since June 11, as attacks disrupted shipping through the Strait of Hormuz. Oil later retreated to $87.94 after Iran acknowledged proposals from mediators, but traffic through the waterway remained restricted.
According to UBS analyst Giovanni Staunovo, the prospect of renewed diplomacy erased oil’s early advance even though shipping volumes remained depressed.
“Comments from Iran’s foreign ministry spokesperson saying that the country has received new proposals from mediators have seen oil prices giving up all earlier gains, though flows through the Strait of Hormuz remain depressed.”
Only four vessels crossed the strait on Sunday, down from eight one day earlier, LSEG data showed. About 20% of global oil supplies passed through the route before the war, which leaves energy markets exposed to further attacks or a prolonged disruption.
Higher fuel costs have also complicated the Federal Reserve outlook. Futures markets now expect at least one rate increase before year-end despite softer U.S. consumer inflation data last week. The 10-year Treasury yield reached 4.55%, while the 30-year yield moved above 5%, raising the return available from fixed-income assets.
Technology stocks supplied another source of pressure. South Korea’s chip-heavy equity index lost 4.1% on Monday after falling almost 9% last week, while the Philadelphia Semiconductor Index has dropped 20% from its June record. Investors have reassessed expensive AI companies following Moonshot AI’s release of its open-weight Kimi K3 model.
Institutional demand has not disappeared during the market retreat. U.S. spot XRP ETFs attracted $6.78 million last week, according to data aggregated by SoSoValue. The seven listed products now hold about 971 million XRP, although their combined assets have fallen near $1 billion as the token’s market price declined.
Bitwise chief investment officer Matt Hougan previously described XRP demand from professional investors as resilient despite weak crypto conditions.
“Despite a challenging overall crypto market, we’ve seen consistent inflows into XRP ETFs, including hundreds of millions from institutional and professional investors.”
ETF accumulation has yet to generate enough spot demand for a breakout. XRP remains roughly 70% below its record high, while the Crypto Fear & Greed Index at 35 shows that traders still favor defensive positioning.
XRP price must close above its descending resistance to regain momentum
XRP’s daily chart places the token directly above the Murrey Math trading-range floor at $1.0742. Buyers defended the area several times in July, but every recovery has stopped beneath a descending trendline drawn from the May and July swing highs.

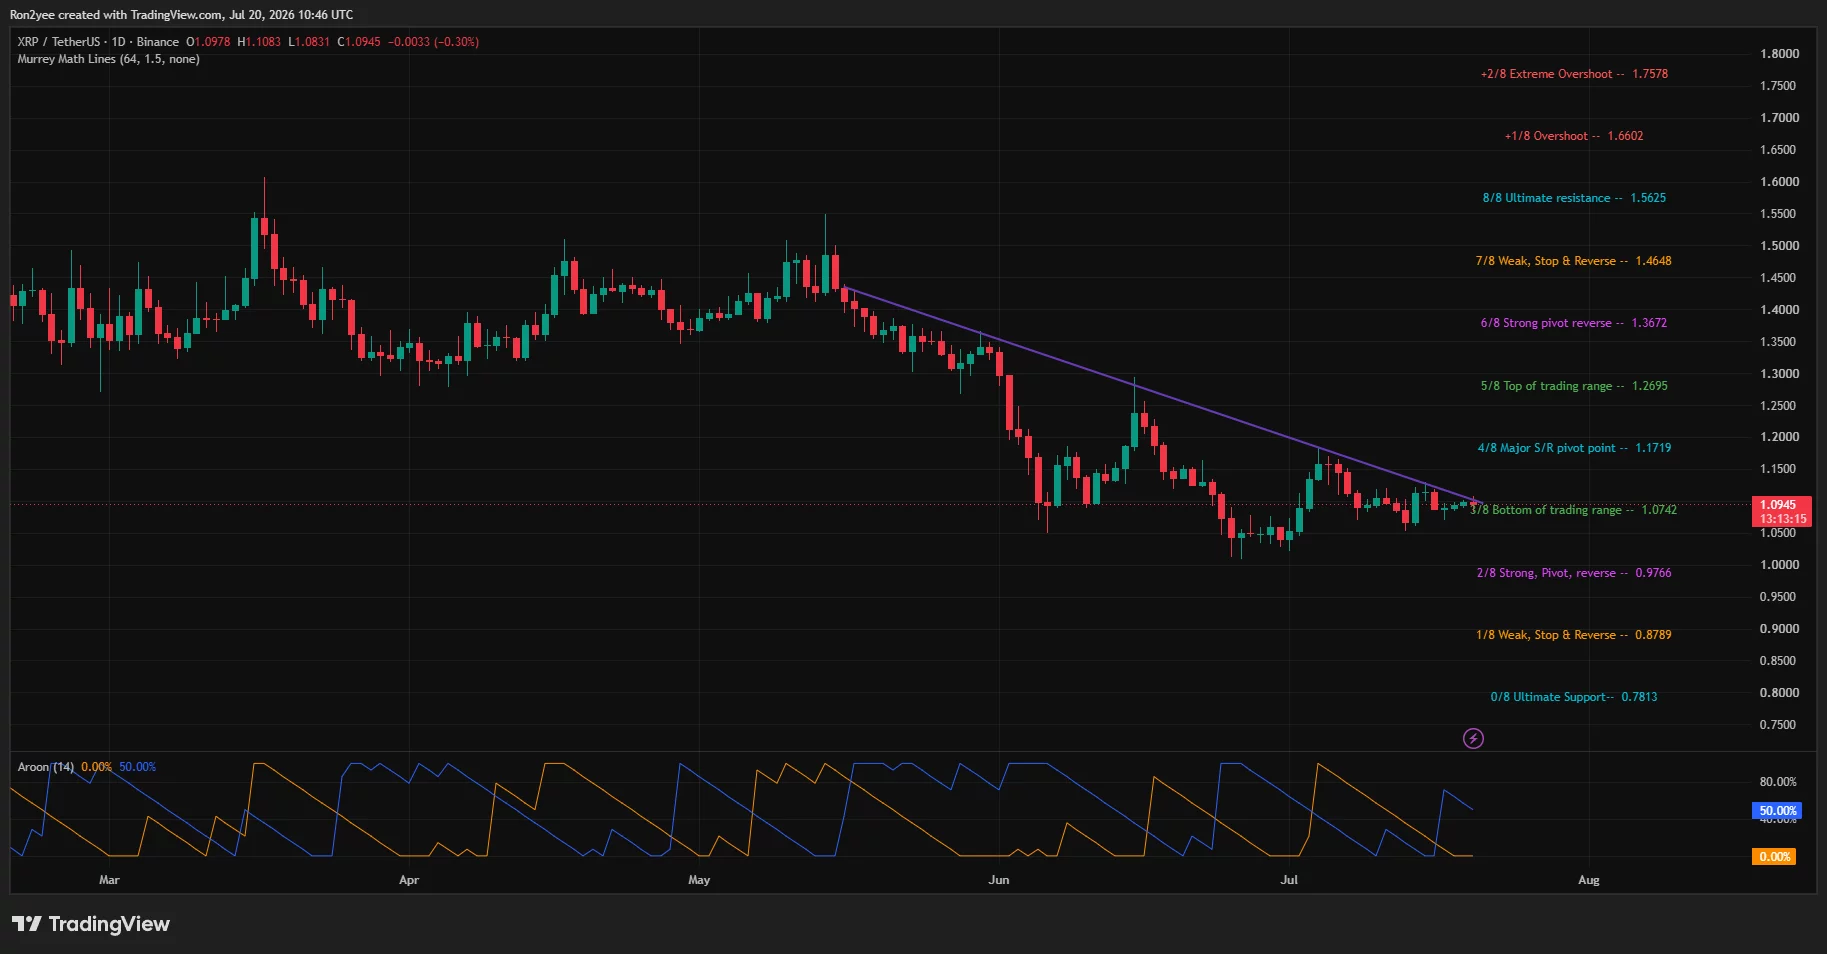
A daily close above that trendline and the $1.10–$1.12 supply zone would provide the first technical confirmation of a reversal. The next Murrey resistance sits at $1.1719, followed by the top of the trading range at $1.2695. A sustained move through both levels would expose the stronger pivot at $1.3672.
On the 4-hour chart, XRP has traded inside a descending channel since its July 4 peak near $1.18. Price now sits close to the channel’s upper boundary, while lower support runs through approximately $1.04. The structure permits a breakout attempt, but recent candles show little expansion in either direction.
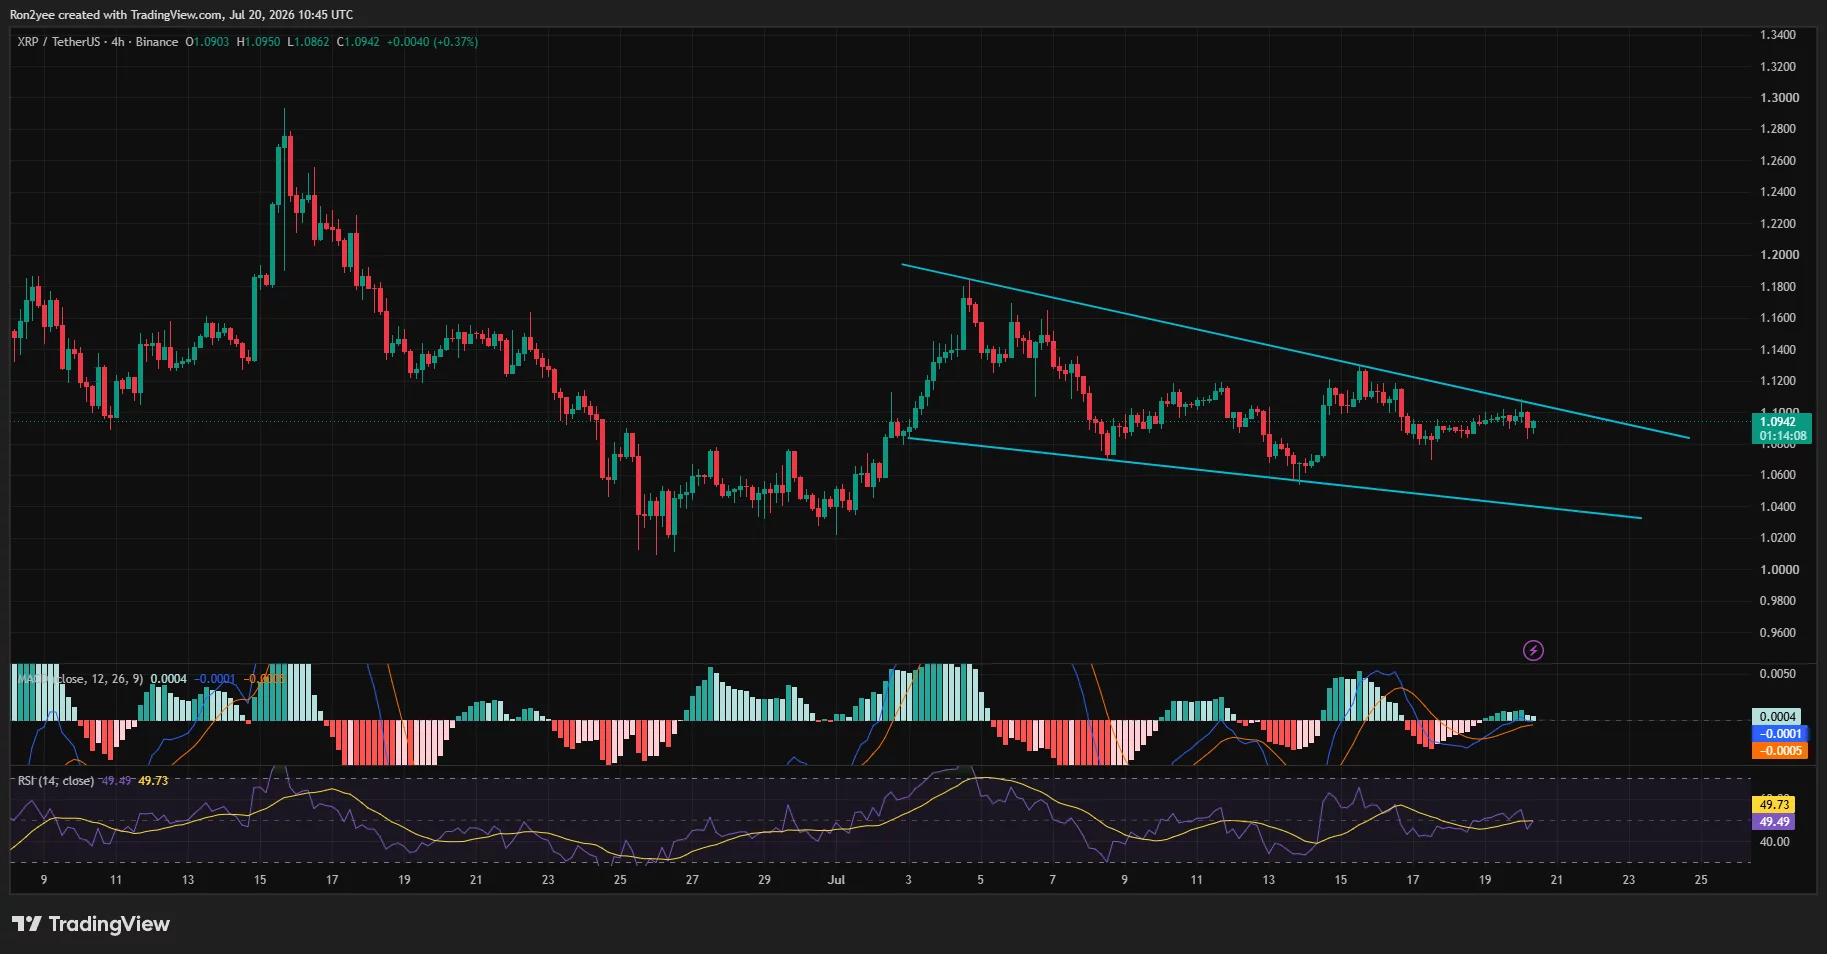
Momentum readings remain undecided. The 4-hour relative strength index stands at 49.49, almost exactly at the neutral midpoint, while its signal average is 49.73. MACD has moved marginally above its signal line, though the histogram reading of 0.0004 shows that bullish momentum remains weak.
The daily Aroon readings provide a slightly stronger setup. Aroon Up stands at 50%, compared with Aroon Down at 0%, which gives buyers a modest advantage without confirming a durable trend. No conventional moving-average overlays appear on the supplied charts, making the descending trendline, channel boundaries, and Murrey pivots the clearest trend gauges.
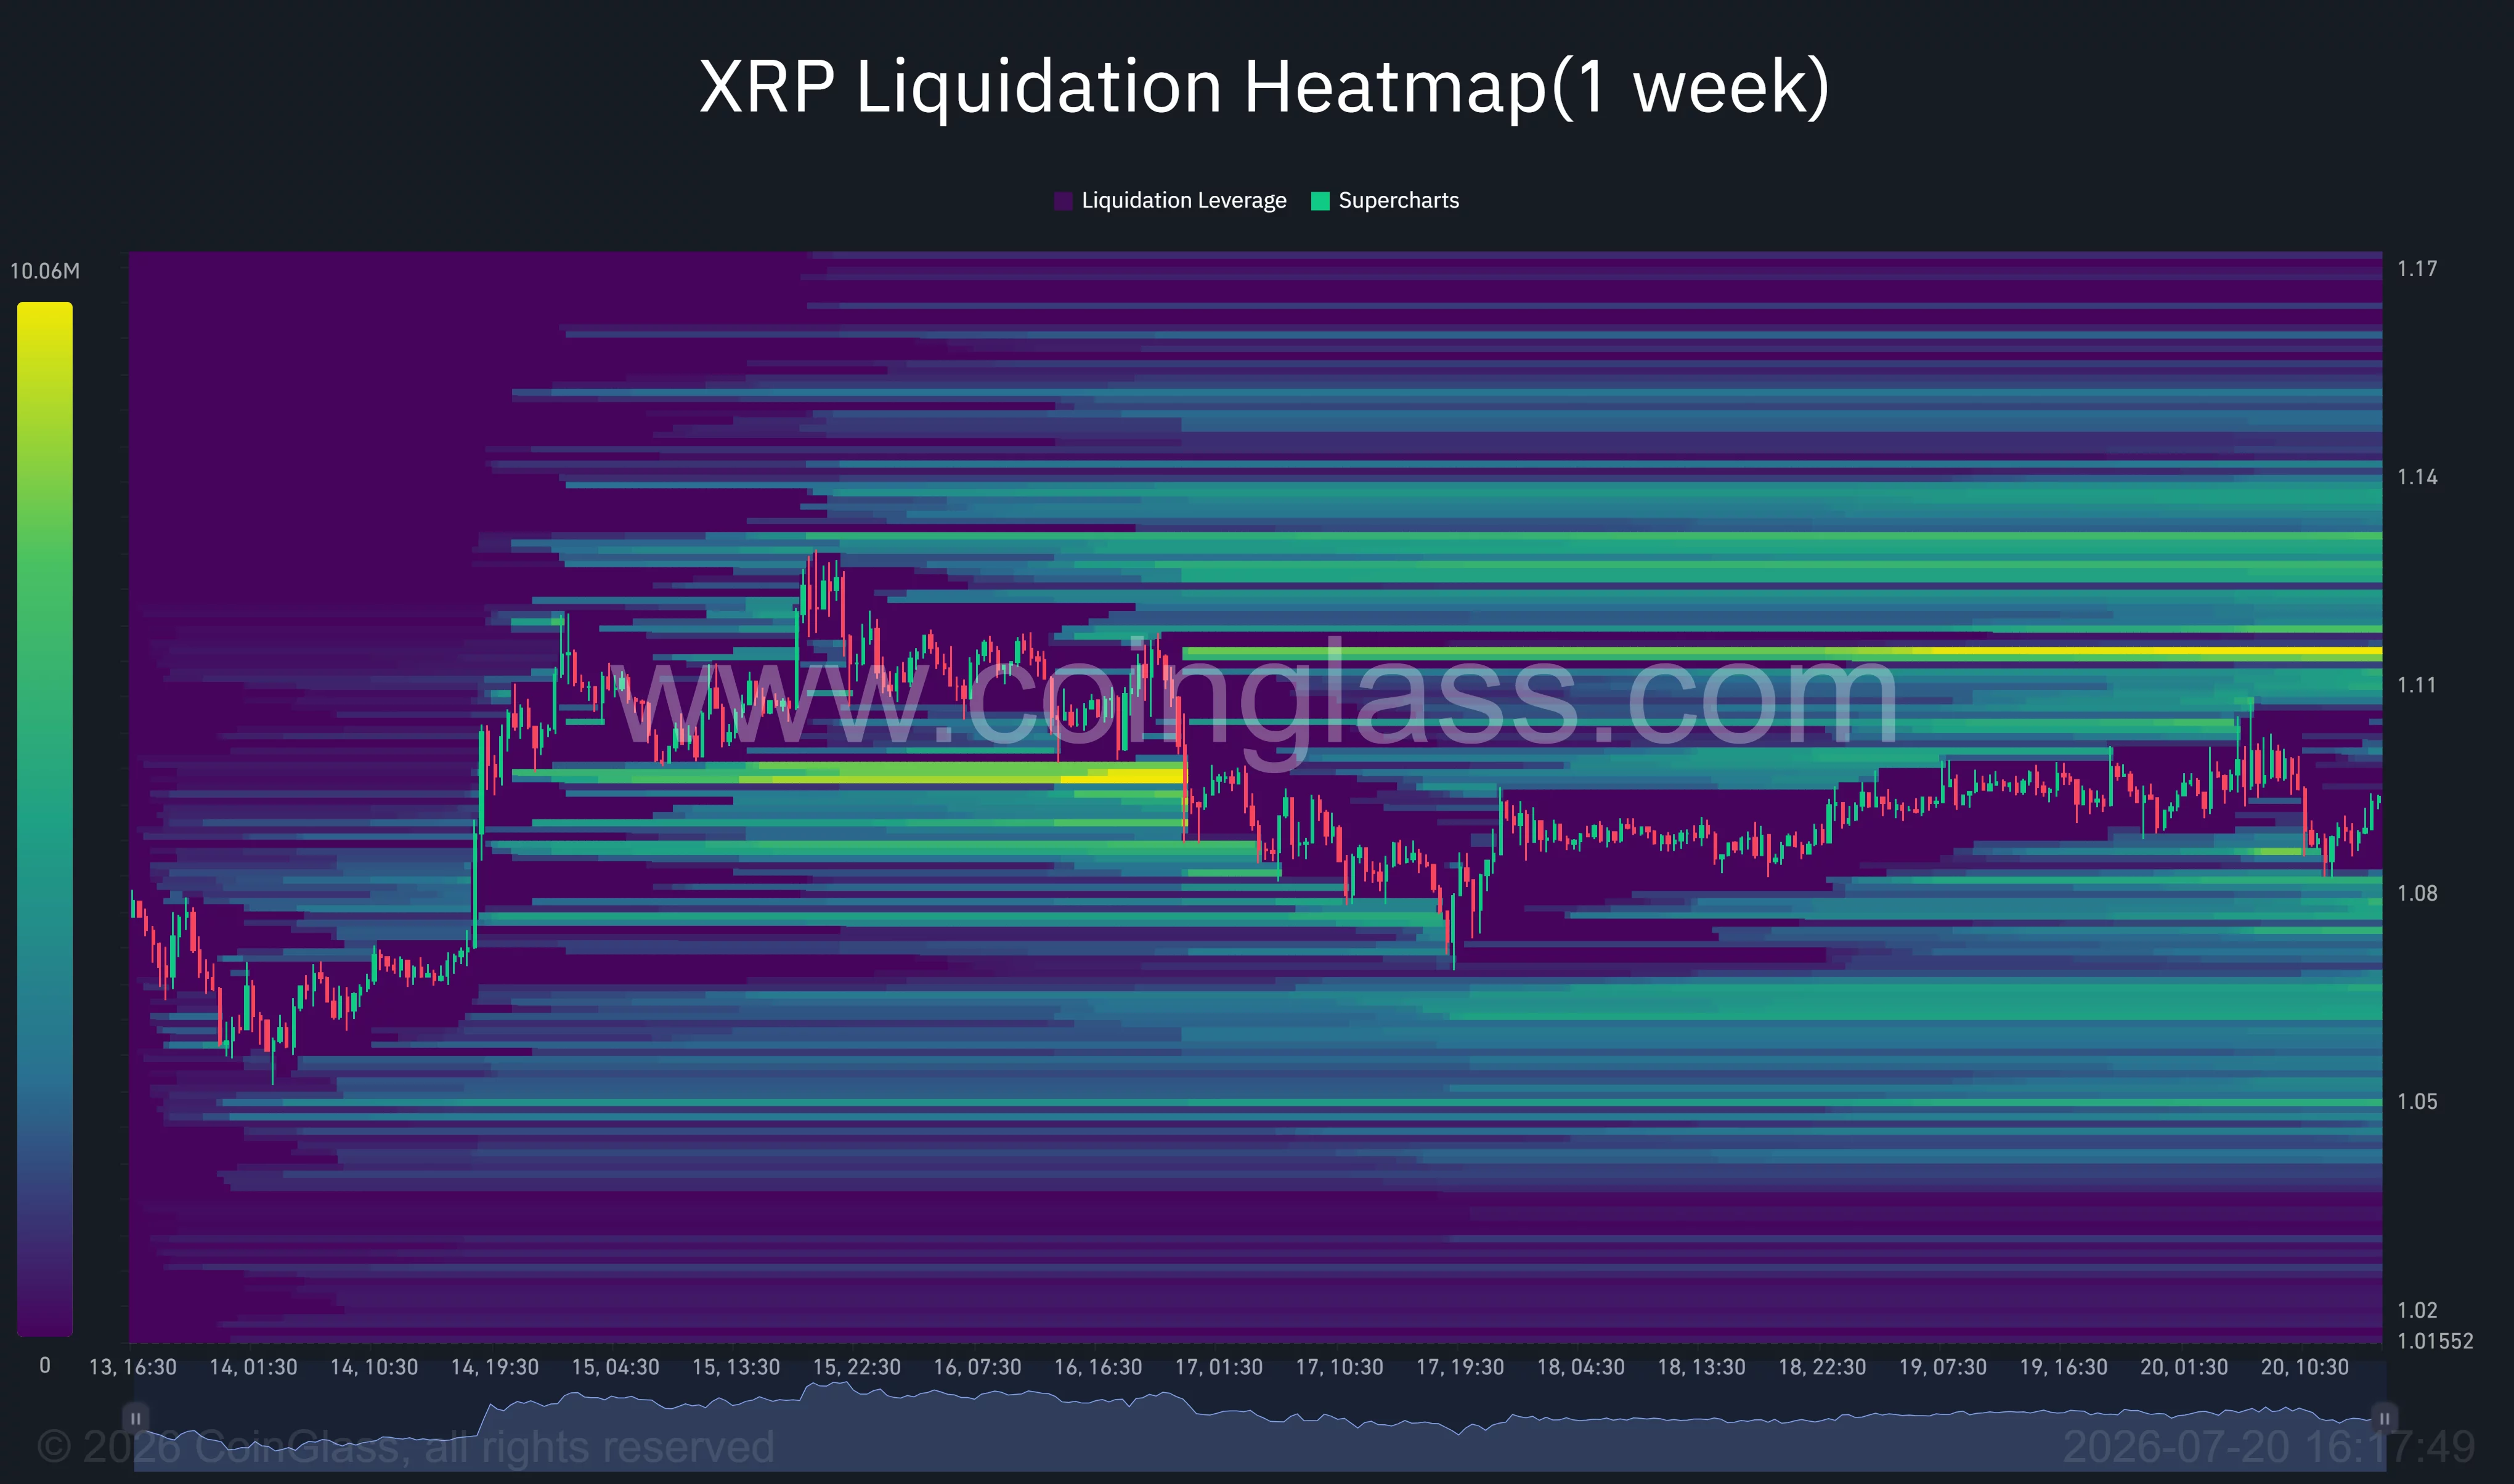
CoinGlass’s weekly liquidation heatmap shows the largest nearby concentration of leveraged positions around $1.11–$1.115. A move through that band could force short liquidations and accelerate a run toward $1.13, where another dense liquidity zone has formed. Below market price, notable long-liquidation pockets sit around $1.08 and $1.06.

Loss of $1.07 would invalidate the immediate recovery setup
XRP’s bullish case would weaken if sellers push price below the $1.0742 daily pivot and the 4-hour channel support. Such a move would expose $1.04 before the stronger Murrey reversal level at $0.9766.
A close below $0.9766 would invalidate the current consolidation thesis and place $0.8789 back in play. Extended weakness could eventually send XRP toward the chart’s ultimate support at $0.7813.
Escalating attacks near Hormuz remain the principal external risk. Another oil spike could revive inflation expectations, lift Treasury yields, and reduce demand for altcoins. XRP therefore needs both a confirmed close above $1.12 and an improvement in global risk appetite before buyers can target the higher resistance levels.
Disclosure: This article does not represent investment advice. The content and materials featured on this page are for educational purposes only.


