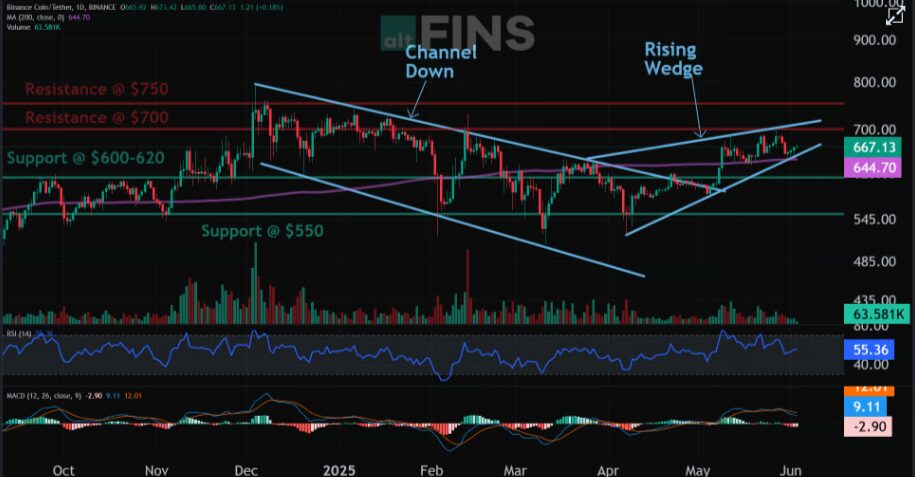
BNB (Binance Coin) is trading at approximately $667.57, reflecting a 0.36% increase over the last 24 hours. The token has experienced moderate intraday movement, reaching a high of $671.69 and a low of $659.66.
In this article, we will look at Bnb next target by looking at technicals and price chart.
For on-demand analysis of any cryptocurrency, join our Telegram channel.
BNB Next Target
- Current Price: $667.57
- 24h Price Change: +0.36%
- 24h Range: $659.66 – $671.69
- Market Cap: ~$92.38 billion
- 24h Trading Volume: ~$700 million
- Circulating Supply: ~140.89 million BNB
- Total Supply: ~157 million BNB (after periodic burns)

There are signs of bullish trend reversal: breakout from Channel Down pattern and above 200-day Moving Average ($636). Price reached $700 resistance, where it got rejected so far. It’s trading in a Rising Wedge.
We wait for price to pull back near $640 support (200 SMA) for another swing trade entry in Uptrend with upside potential back to $700.
📈 Key Technical Indicators
- Relative Strength Index (RSI): ~40.8 (Neutral)
- MACD: Slight bearish crossover
- Support Levels: $650, $646
- Resistance Levels: $669.68, $675
- Trend: Sideways with a slight bullish bias if resistance breaks
📰 Latest BNB News & Highlights
- Positive momentum returns: BNB is gaining strength as macroeconomic pressures ease slightly, with increased volume on major exchanges.
- Strong trading interest: Notable activity observed on the BNB/USDT pair with spikes in volume suggesting renewed investor interest.
- On-chain signals stable: Whale accumulation has slowed, but long-term holders continue to show confidence in BNB’s fundamentals.
👉 Short-Term Forecast: Neutral to bullish
📉 Risk Level: Moderate, based on overall market sentiment
For on-demand analysis of any cryptocurrency, join our Telegram channel.