


Mantle’s price hit a new all-time high on Tuesday, driven by partnerships that are bootstrapping liquidity and trading volume on the network, while the project also expands its focus into the RWA sector.
Summary
- Mantle price has hit a new peak at $2.47 on Tuesday.
- Recent partnerships and the project’s growing focus on the RWA tokenization sector have supported MNT’s gains.
- MNT invalidated a rising wedge pattern on the daily chart.
According to data from crypto.news, Mantle (MNT) surged to a new all-time high of $2.47 on Oct. 7, morning Asian time, before stabilizing at $2.26 as of press time. It has rallied 125% from last month’s low and 340% from its lowest point this year.
Daily trading volume for the token also saw a notable uptick, rising from $125 million seen in early September to over $612 million, while its market cap nearly doubled over the same period to $7.34 billion, making it the 32nd largest crypto asset when writing.
Mirroring the spike in spot trading volume, open interest in Mantle’s futures market surged by 26% over the past week to $4.85 billion, while the weighted funding rate remained positive for nearly two weeks, a sign that long-position holders have been paying short-position holders to maintain their positions, reflecting strong bullish sentiment in the market.
Why is Mantle price going up?
There are three major catalysts behind Mantle’s price surge over recent weeks.
First, during Token2049, Mantle unveiled its new compliance-oriented RWA service. The move has positioned the project as one of the few L2 ecosystems actively building in the real-world asset space, a narrative that has grown increasingly hot this year.
Second, a major announcement came at the Mantle Mixer last week, where Trump family-backed World Liberty Financial revealed that it would be launching its flagship stablecoin, USD1, on the Mantle network. Given that USD1 currently stands as the 6th largest stablecoin with a market cap surpassing $2.6 billion, the partnership is being seen as a huge credibility boost for Mantle’s DeFi and stablecoin ecosystem.
Finally, bullish momentum for the token has also been amplified by Mantle’s growing synergy with centralized crypto exchange Bybit. Late last month, Bybit presented the “Mantle × Bybit Roadmap”, outlining deeper integration between the two platforms. Considering Bybit processes over $30 billion in daily trading volume, the exposure and network effects for MNT have grown significantly in a very short time.
However, Mantle’s rally could face some hiccups, as smart money investors seem to be exiting their positions. According to data from Nansen, the total amount of MNT held by smart money has dropped by nearly 49% over the past 30 days, falling to just 18.07 million tokens at the time of writing.

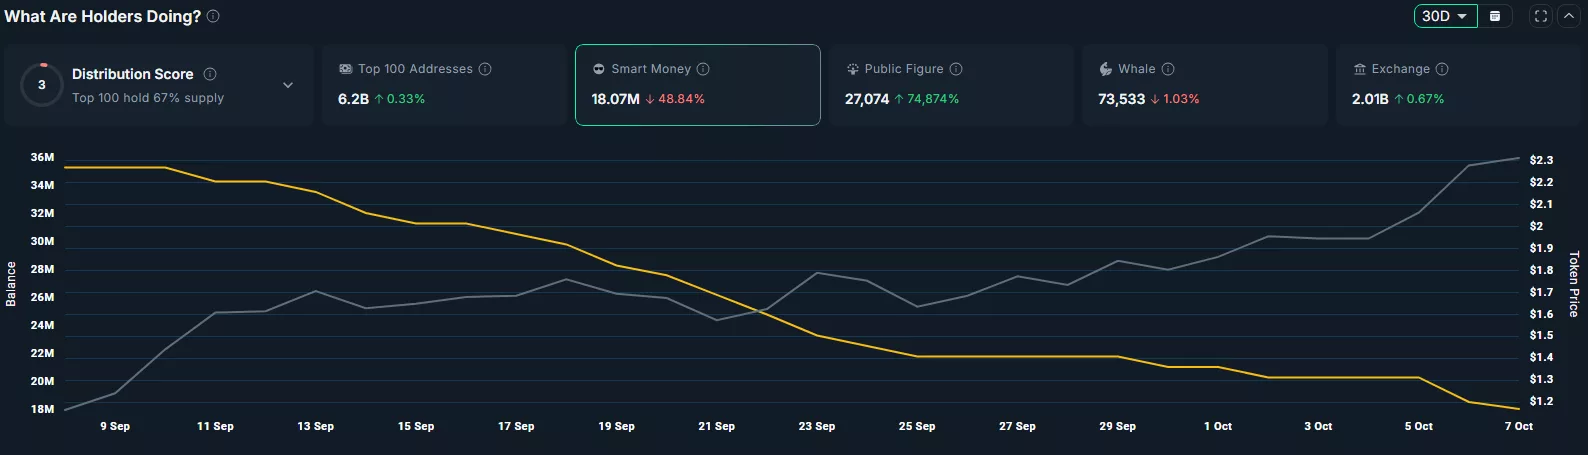
This kind of steady selloff from seasoned investors could raise a few eyebrows. For some traders, it might be a red flag, a signal that those with deeper insight or early allocations are quietly taking profits. While retail sentiment remains strong, this shift in smart money positioning could inject a bit of caution into what has otherwise been a very bullish run.
On the daily chart, Mantle has confirmed a bullish breakout from a rising wedge pattern. Usually, rising wedges are typically followed by bearish reversals. However, in MNT’s case, the price broke out from the upper trendline, invalidating the typical bearish outlook that rising wedges tend to imply.

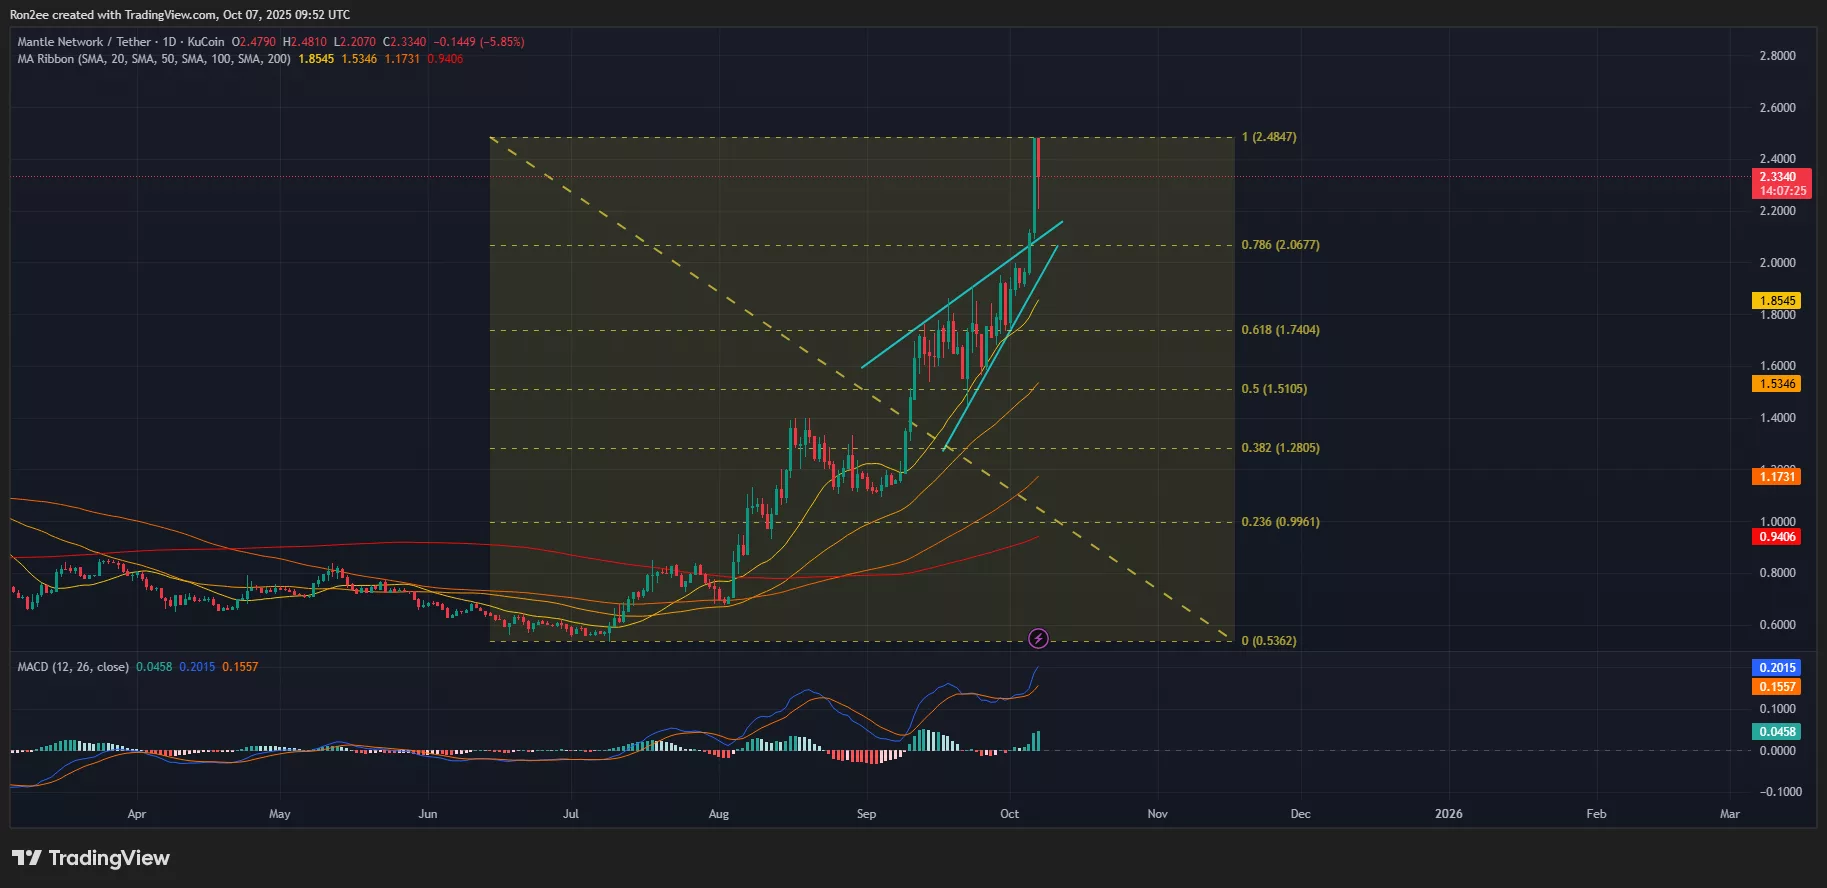
Such breakouts are not unusual during strong uptrends, especially when underlying fundamentals continue to support bullish sentiment.
Adding to the bullish case, MNT is now trading above all its key moving averages, with the short-term averages stacked above the long-term ones, a classic signal of trend strength. Notably, the 50-day moving average has crossed above the 200-day, forming a golden cross, which often precedes sustained rallies.
Momentum indicators are supporting this bullish backdrop. The MACD has printed a positive crossover, and the growing green histogram bars on the chart reflect increasing buyer strength, all of which are signs of a market that is leaning heavily in favor of the bulls.
Looking ahead, the next major resistance sits at $2.60, which also acts as a psychological barrier for traders. A clean breakout above it, especially with strong volume confirmation, could open the gates for a push toward the $3 mark.
On the flip side, $2.00 serves as the immediate support, a level bulls will want to hold to keep the momentum alive.
Disclosure: This article does not represent investment advice. The content and materials featured on this page are for educational purposes only.

 to Trade Crypto (November 2025)")

